Case overview
As part of regulatory requirements, Pharmatech is subject to regular inspections by the Food and Drug Administration (FDA) to ensure compliance with Good Manufacturing Practices (GMP) and other regulations. In preparation for the FDA inspection, Pharmatech is required to produce an Annual Product Quality Review (APQR) for each of its marketed drugs.
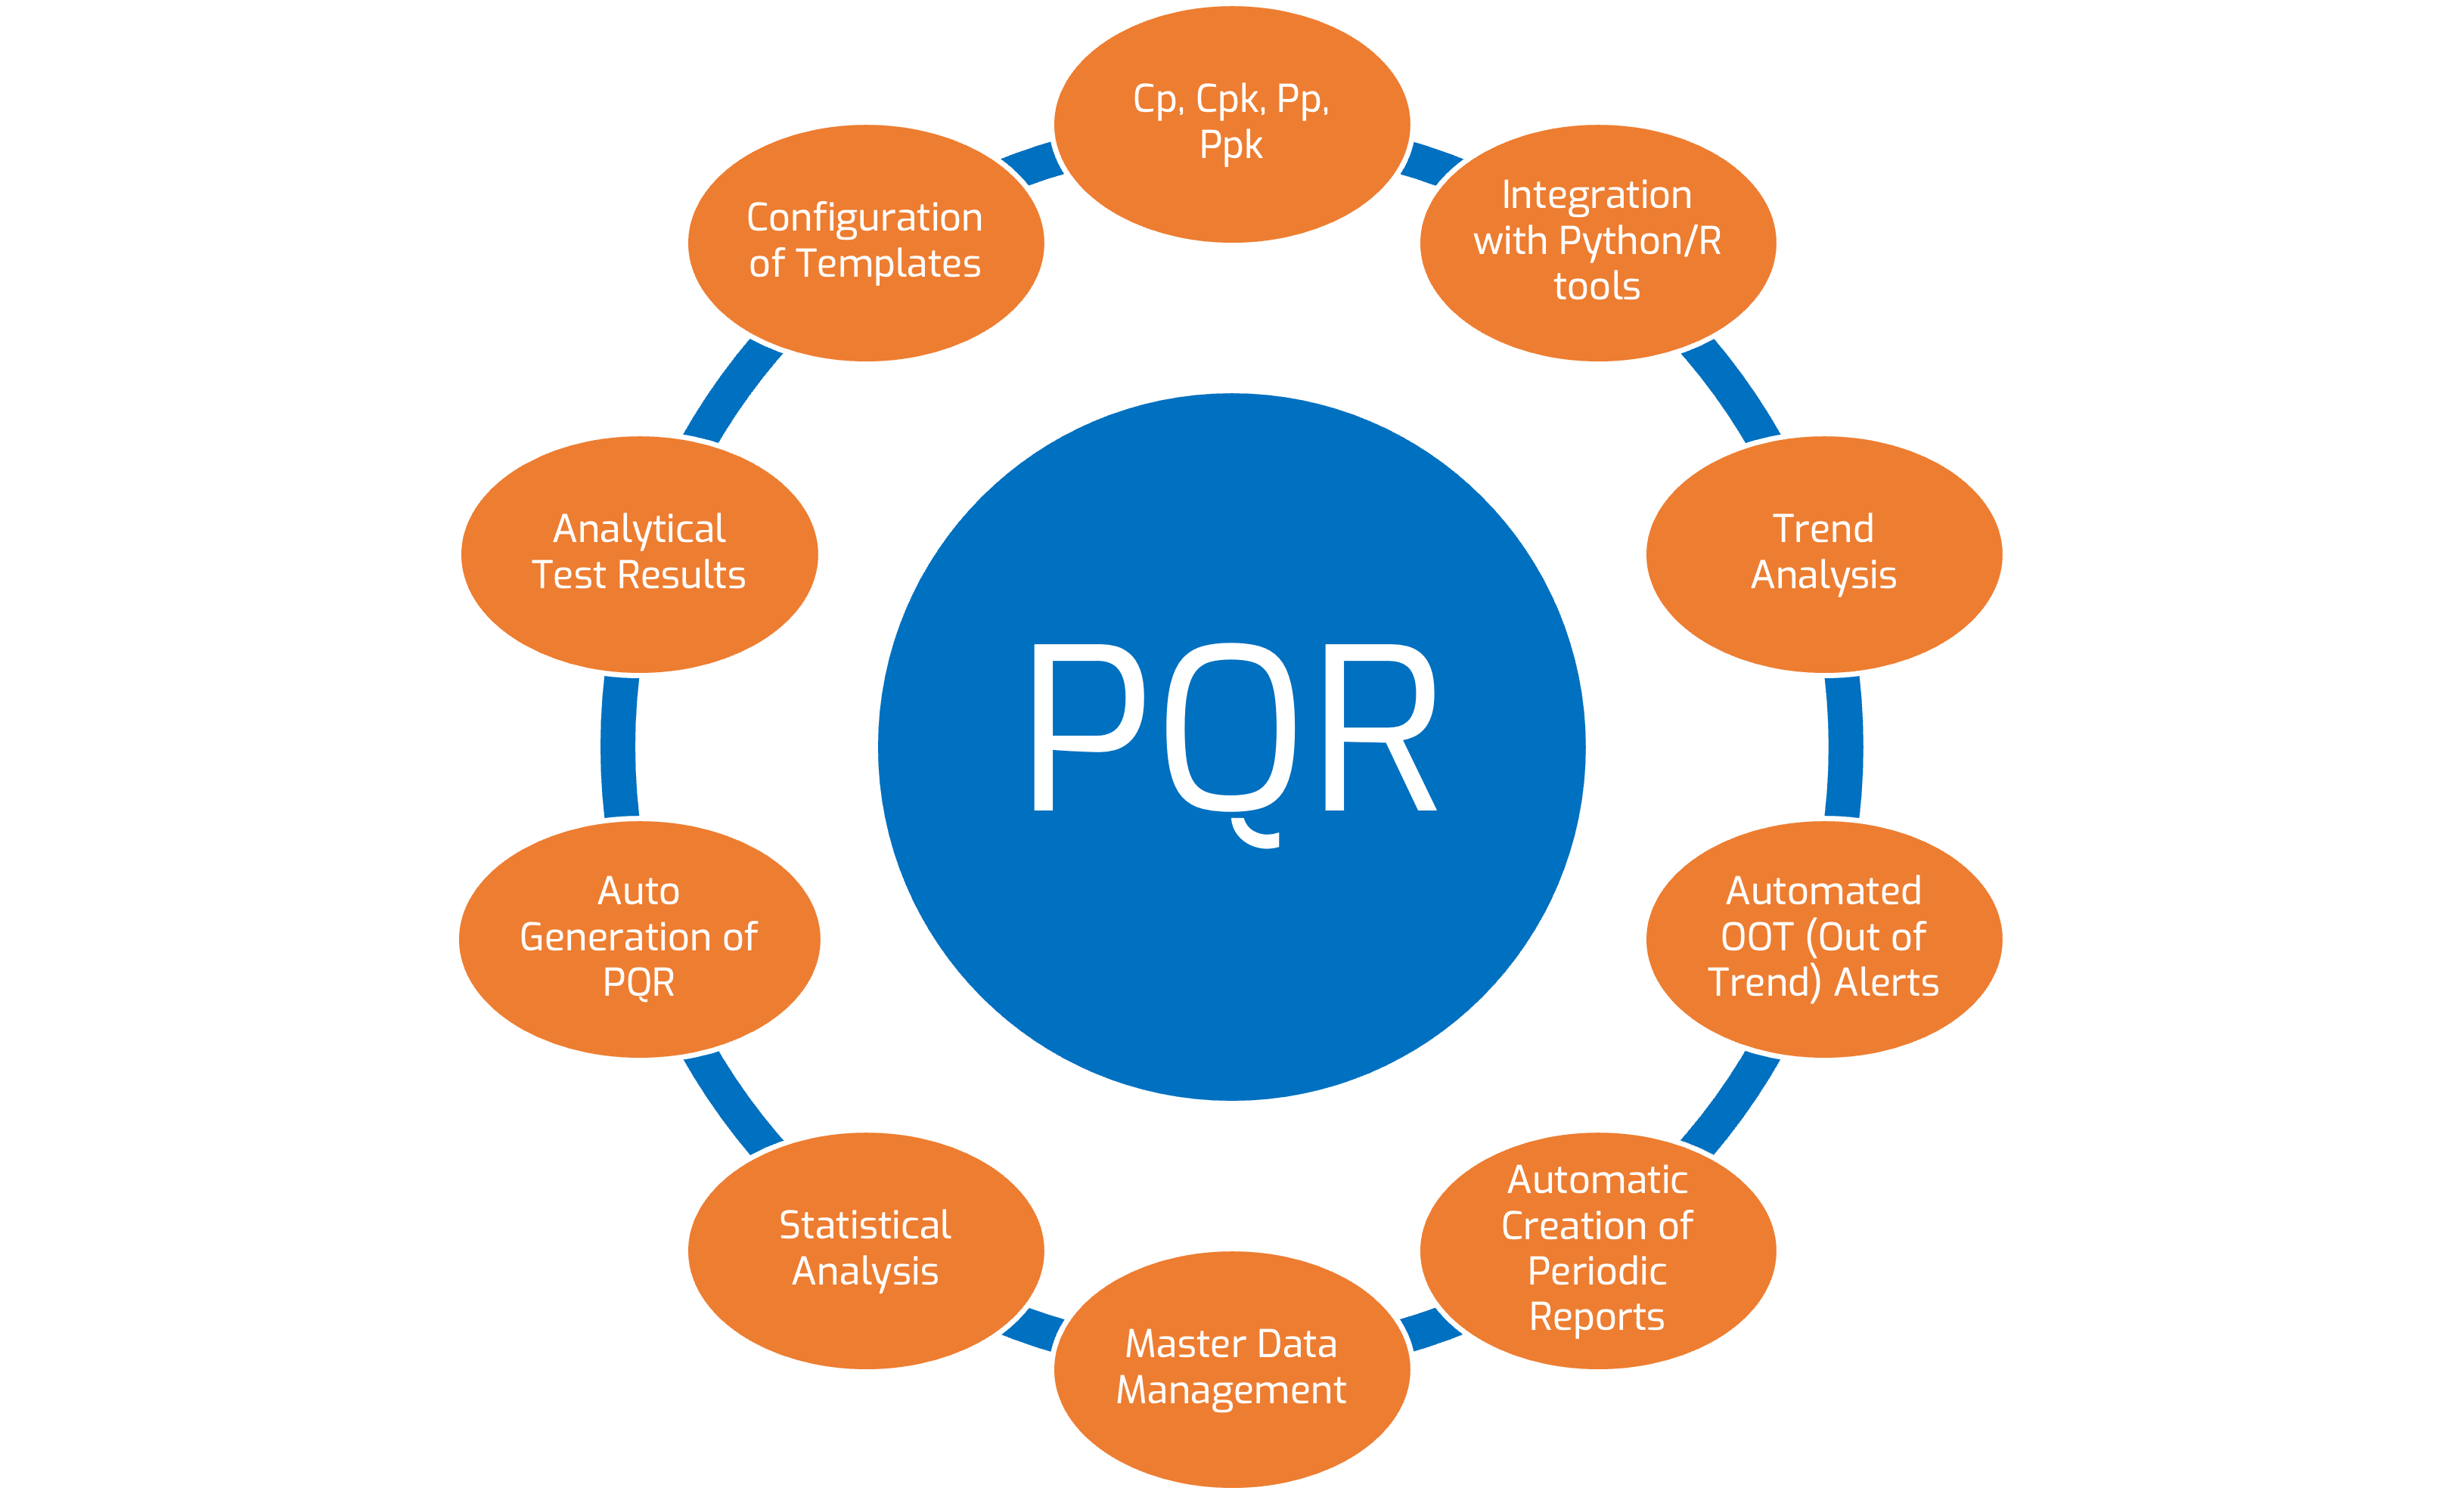
To support the findings presented in the APQR and ensure the accuracy of the data analysis, Pharmatech decides to enlist the expertise of Kiwi Data Science. This analysis involves assessing the distribution, the stability of the process and the evaluation of various performance metrics such as Cp, Pp, Cps and Ppk.
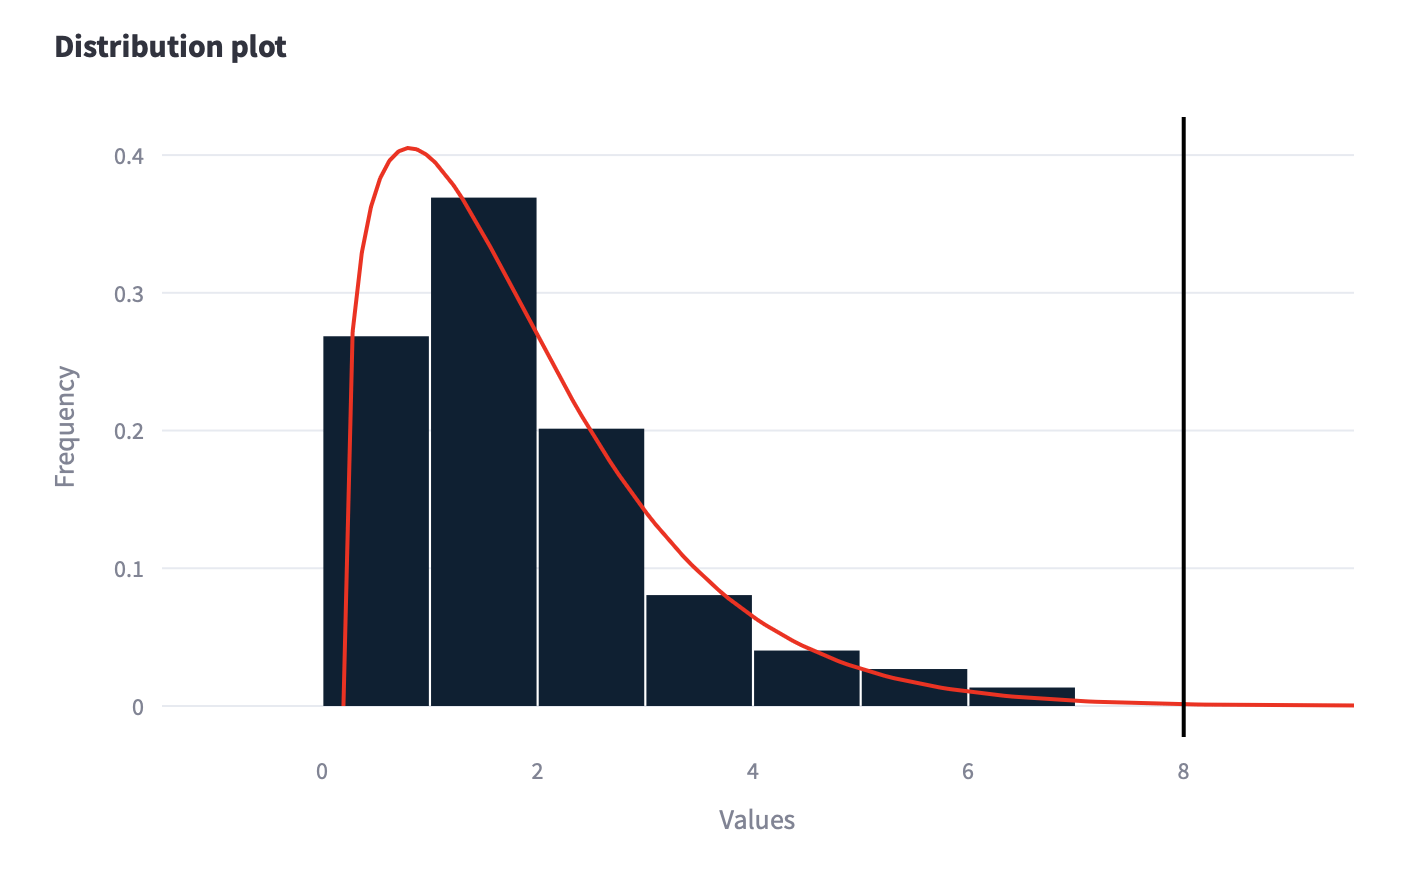
Distribution
A distribution analysis involves examining how data points are spread out within a dataset. It includes techniques like frequency distribution, histograms, descriptive statistics, and probability distributions. The goal is to understand the pattern, central tendency, variability, and shape of the data distribution. This analysis helps in identifying outliers, assessing normality, and making informed decisions based on the data’s characteristics.
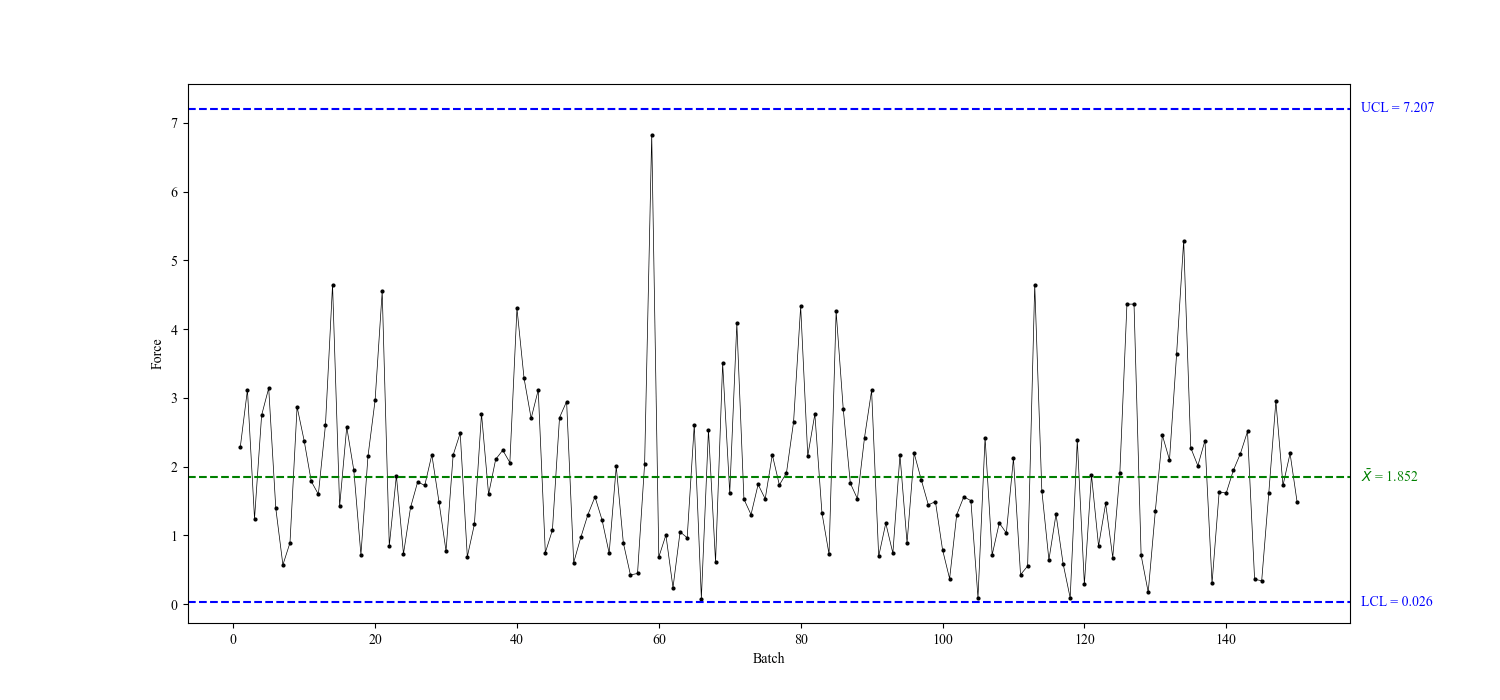
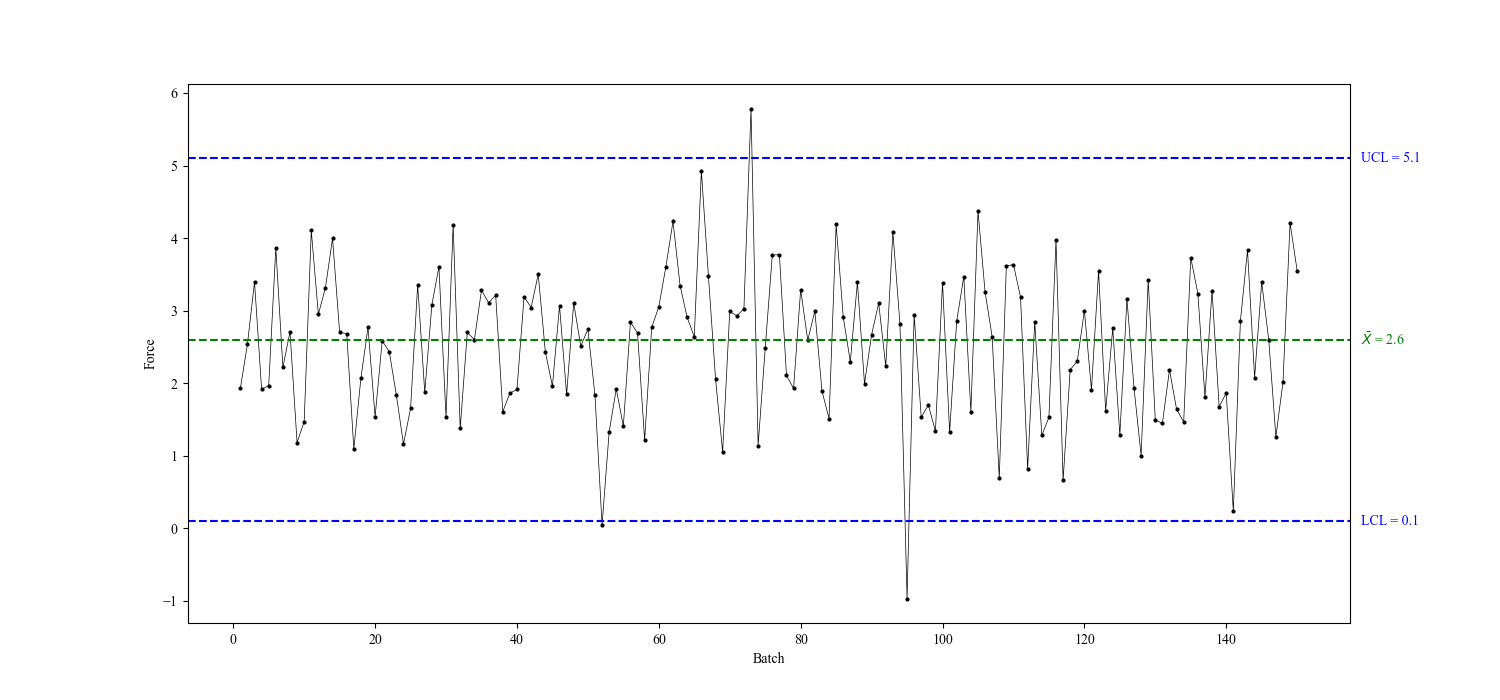
Control chart
A control chart is a graphical representation of process data over time. It typically includes a central line representing the mean or target value and upper and lower control limits, which are set based on historical data or established standards. Data points falling within these limits indicate that the process is in control, while points outside the limits suggest variation that may require investigation.
Capability
Capability analysis evaluates whether a process can consistently produce outputs within specified limits. It typically involves calculating indices such as Cp, Cpk, Pp, or Ppk, which compare the spread of process variation to the width of the specification limits. These indices provide insights into the process capability, indicating how well it meets customer requirements and whether adjustments are needed to improve quality and efficiency.
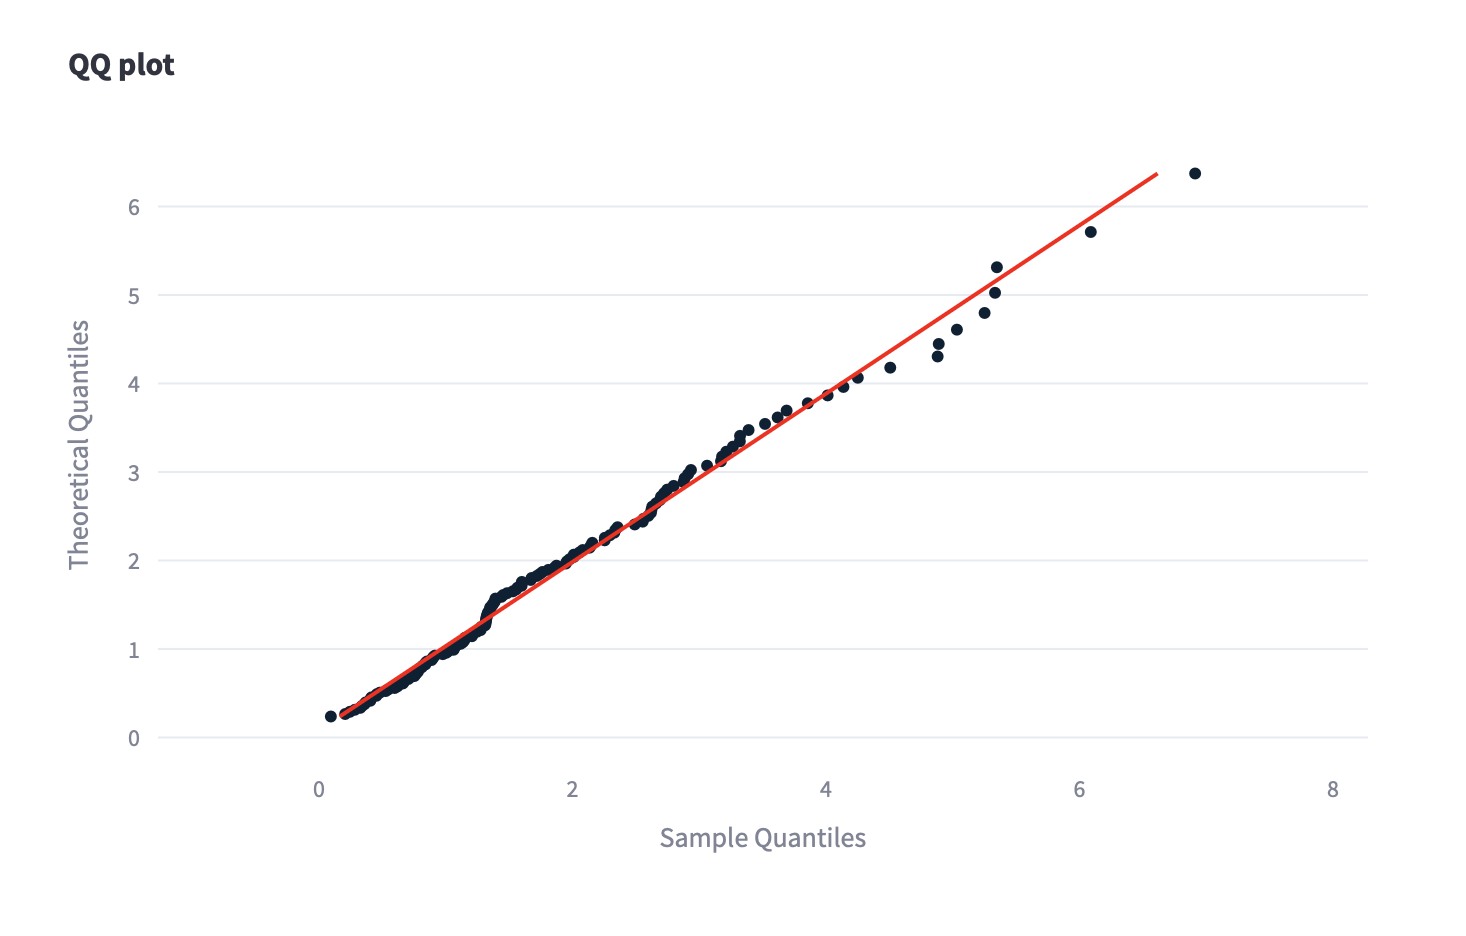
QQ-Plot
The distribution has been investigated from the quantitative point of view using several statistical tests (Anderson Darling, Kolmogorov Smirnov, Ryan-Joiner). In addition, qualitative considerations have been obtained thanks to the use of the QQ-Plot.
The exploration of 73 different distributions provided by the software Scarlet, allowed us to identify the Weibull as the best choice.
Performance
Finally Cp, Cpk, Pp and Ppk KPIs have been calculated providing a complete and detailed description of the Short and Long term capability of the process.

Results